We have invested heavily – in terms of domain knowledge, skill set, and time by the development team in the area of analytics. Analytics and actionable insights are critical for any end-user to put all the data to constructive use.
Some of the work we have done has been in the areas of:
● Trends and patterns
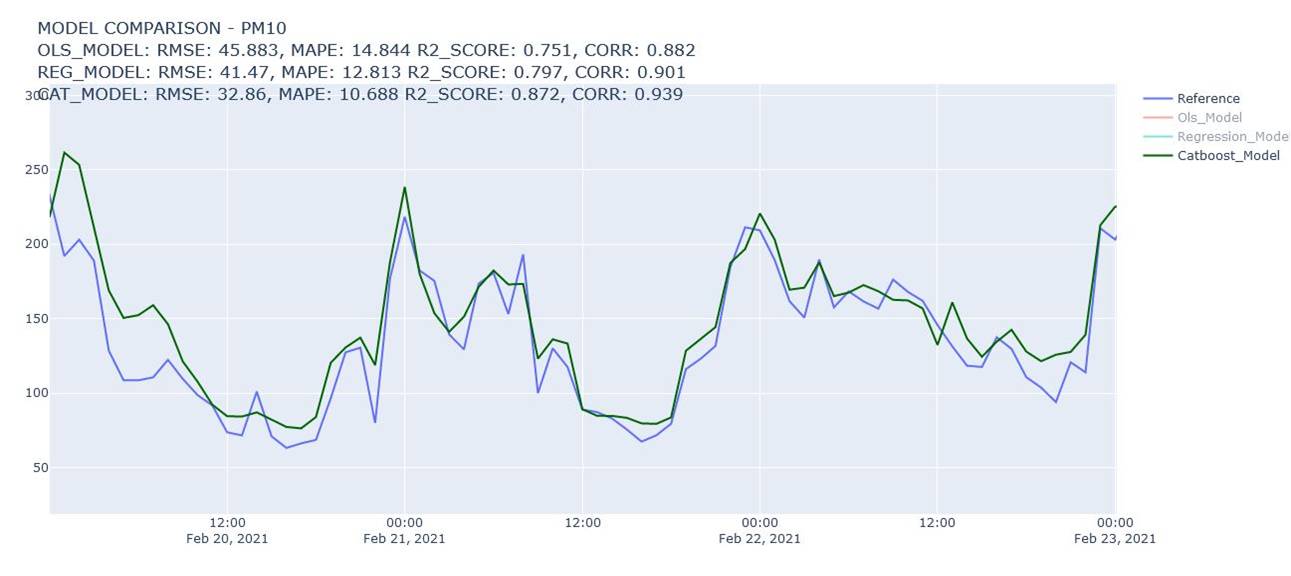
● Predictive analytics
● Source level apportionment: An approach to improve air quality by identifying the emission sources, and the extent of contribution of these sources on the Environment.
Application software Solution
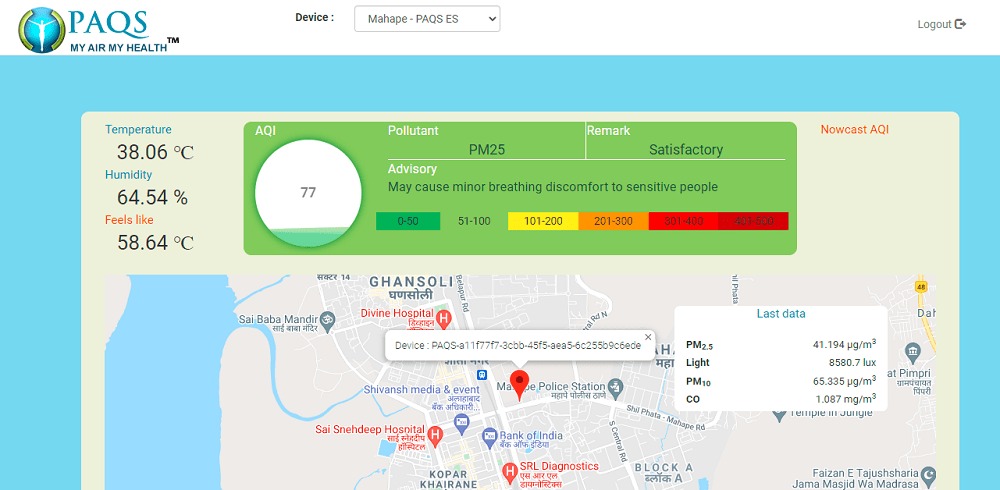
Interactive Dashboard: A Comprehensive Element Management System (EMS) has been developed for monitoring Environmental sensors.
2. Widget: Widget API indicates current pollution levels in various locations. It also represents the real-time air quality data with a calculated Air Quality Index. It also highlights the lead pollutants contributing to NAQI.
Web-based Analytics:
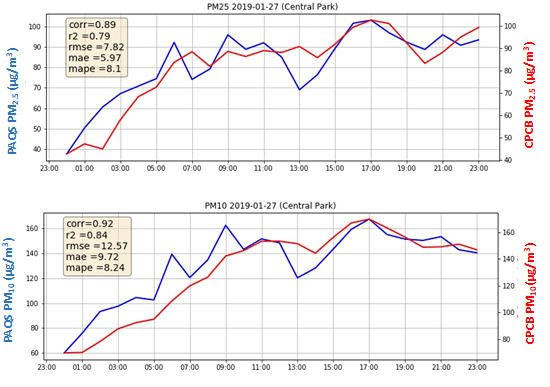
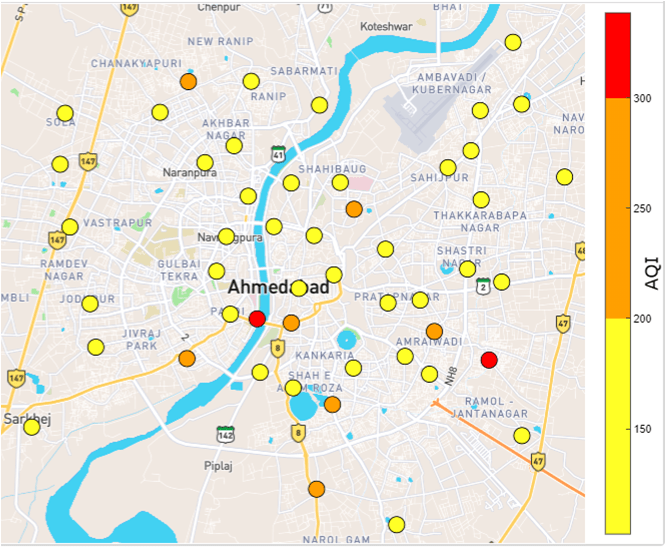
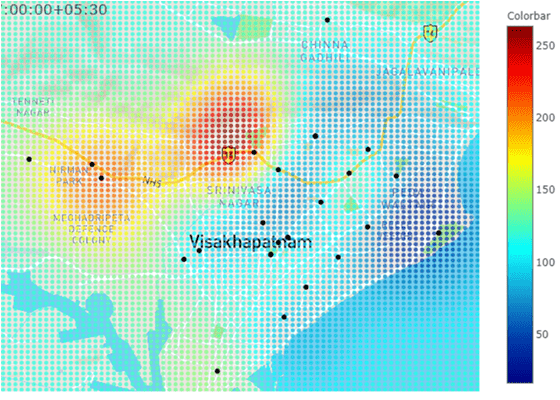
Localized analytics: Accurate hyper-local Air Quality data with context-aware calibration models.
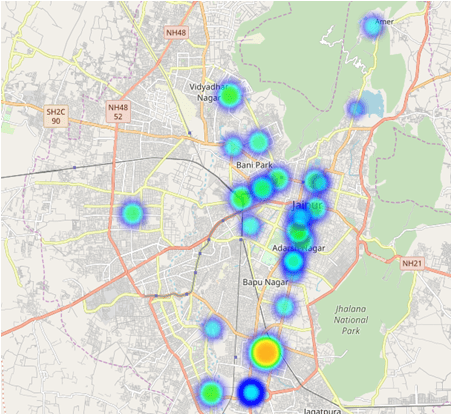
2. Hotspot Analysis: For identification of locations of interest within the city.
3. Spatiotemporal mapping, at the level of 1 square kilometer
Some of the models used are: Gaussian regression/Krigging, Deep belief networks, Multiple linear regression, LSTM, etc